
Station TX PH01 - Abilates
Network: TX - Texas Seismological Network
Nearby stations (2 deg radius)
| Station | Name | (Lat, Lon) | Start / End | Elevation |
| PH01 | Abilates | (35.58, -101.70) | 2018-10-24 / 2599-12-31 | 887 m |
| Crust2 Type: | D8,thick Platform 3 km seds. |
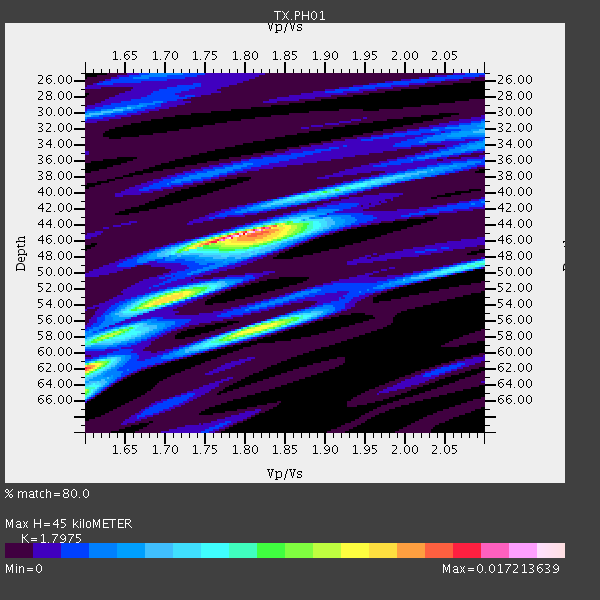
| Thickness Estimate: | 45 km |
| Thickness StdDev: | 7.5 km |
| Vp/Vs Estimate: | 1.80 |
| Vp/Vs StdDev: | 0.12 |
| Vs Estimate: | 3.575 km/s |
| Poisson's Ratio: | 0.28 |
| Peak Value: | 0.02 |
| Assumed Vp: | 6.426 km/s |
| Ps Weight: | 0.33333334 |
| PpPs Weight: | 0.33333334 |
| PsPs Weight: | 0.33333328 |
| Residual Complexity: | 0.682 |
| Nearby stations H: | +- |
| (2.0 deg) Vp/Vs: | +- |
3 with match > 90% ( 16.666666 %) and 5 with match > 80% ( 27.777779 %) out of 18.
Download stack as xyz text file.
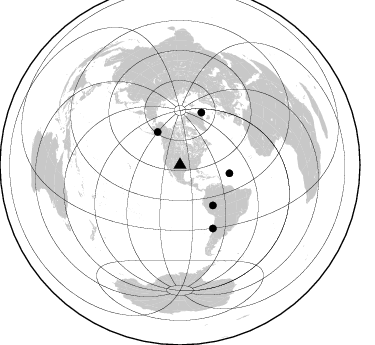
Azimuth Distribution of Events:
Prior Results for this Station
| Study | Thickness | Vp/Vs | Vp | Vs | Poissons Ratio | Extra |
| EARS | 45 km | 1.80 | 6.426 km/s | 3.575 km/s | 0.28 | |
| Crust2.0 | 46 km | 1.78 | 6.426 km/s | 3.613 km/s | 0.27 | D8,thick Platform 3 km seds. |
| Global Maxima | 45 km | 1.80 | 6.426 km/s | 3.575 km/s | 0.28 | amp=0.017213639 |
| Local Maxima 1 | 62 km | 1.60 | 6.426 km/s | 4.016 km/s | 0.18 | amp=0.013611338 |
| Local Maxima 2 | 56 km | 1.83 | 6.426 km/s | 3.521 km/s | 0.29 | amp=0.00806959 |
| Local Maxima 3 | 58 km | 1.63 | 6.426 km/s | 3.93 km/s | 0.20 | amp=0.007931541 |
| Local Maxima 4 | 53 km | 1.72 | 6.426 km/s | 3.736 km/s | 0.24 | amp=0.0075341566 |
| Predicted Arrivals for vertical incidence (zero ray parameter) | |
| Ps | 5.58 SECOND |
| PpPs | 19.59 SECOND |
| PsPs/PpSs | 25.17 SECOND |
Events Processed for this Station
Download zip of receiver functions as SAC
Plot maxima for each earthquake.
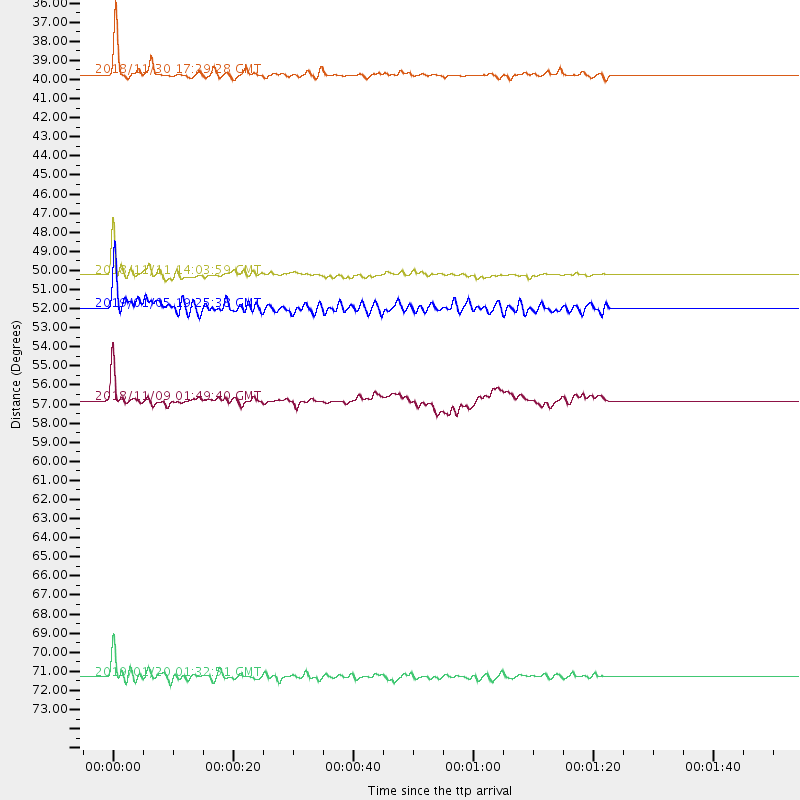
Events Used in the Stack
(5 events)| Radial Match | Distance | Baz | FERegion | Time | Lat/Lon | Depth | Magnitude |
| 94.60226 | 50.2 deg | 99.559 deg | North Atlantic Ocean | 2018/11/11 14:03:59 GMT | (15.6, -49.9) | 10 km | 6.2 mb |
| 94.07524 | 71.3 deg | 152.512 deg | Near Coast Of Central Chile | 2019/01/20 01:32:51 GMT | (-30.1, -71.4) | 53 km | 6.7 mww |
| 94.0636 | 39.7 deg | 325.741 deg | Southern Alaska | 2018/11/30 17:29:28 GMT | (61.3, -149.9) | 43 km | 6.6 ml |
| 87.15339 | 51.9 deg | 140.862 deg | Western Brazil | 2019/01/05 19:25:38 GMT | (-8.1, -71.6) | 575 km | 6.8 Mww |
| 86.42185 | 56.8 deg | 22.269 deg | Jan Mayen Island Region | 2018/11/09 01:49:40 GMT | (71.6, -11.2) | 10 km | 6.8 Mww |
Losers
(13 events)| Radial Match | Distance | Baz | FERegion | Time | Lat/Lon | Depth | Magnitude | Reason |
| 86.18876 | 88.1 deg | 243.178 deg | Tonga Islands | 2018/11/10 08:33:16 GMT | (-20.5, -173.8) | 10 km | 6.2 Mww | |
| 77.966194 | 90.3 deg | 248.209 deg | Fiji Islands Region | 2018/11/18 20:25:45 GMT | (-17.9, -178.9) | 534 km | 6.7 Mww | |
| 69.48377 | 55.3 deg | 311.629 deg | Andreanof Islands, Aleutian Is. | 2019/01/05 18:47:11 GMT | (51.0, -178.2) | 35 km | 6.0 Mi | |
| 65.976135 | 40.1 deg | 185.792 deg | Central East Pacific Rise | 2019/01/30 15:31:34 GMT | (-4.6, -105.4) | 10 km | 5.9 Mww | |
| 64.85263 | 84.3 deg | 316.386 deg | Near East Coast Of Honshu, Japan | 2019/01/26 08:23:02 GMT | (40.3, 142.2) | 37 km | 5.5 Mww | |
| 62.48554 | 64.8 deg | 321.453 deg | Near East Coast Of Kamchatka | 2018/11/14 21:21:50 GMT | (55.6, 162.0) | 50 km | 6.1 Mww | |
| 59.554733 | 39.6 deg | 325.533 deg | Southern Alaska | 2018/11/30 17:35:37 GMT | (61.2, -149.9) | 39 km | 5.8 Ml | |
| 54.23893 | 50.2 deg | 99.612 deg | North Atlantic Ocean | 2018/11/17 13:17:59 GMT | (15.5, -49.9) | 10 km | 5.5 Mww | |
| 54.207695 | 85.9 deg | 245.658 deg | Tonga Islands | 2018/12/26 14:11:21 GMT | (-17.2, -173.6) | 163 km | 6.0 Mi | |
| 53.02958 | 50.2 deg | 99.558 deg | North Atlantic Ocean | 2018/11/27 19:34:46 GMT | (15.6, -49.9) | 10 km | 5.5 Mww | |
| 52.379078 | 79.6 deg | 317.902 deg | Hokkaido, Japan Region | 2018/11/04 19:26:03 GMT | (44.6, 145.6) | 8.0 km | 5.9 Mww | |
| 48.420547 | 84.4 deg | 247.109 deg | Tonga Islands | 2019/01/24 00:52:38 GMT | (-15.1, -173.4) | 10 km | 5.5 mb | |
| 46.689545 | 38.5 deg | 182.762 deg | Central East Pacific Rise | 2018/11/12 22:37:27 GMT | (-3.1, -103.4) | 10 km | 5.6 Mww |

